Climate Zones Look Neat on Maps
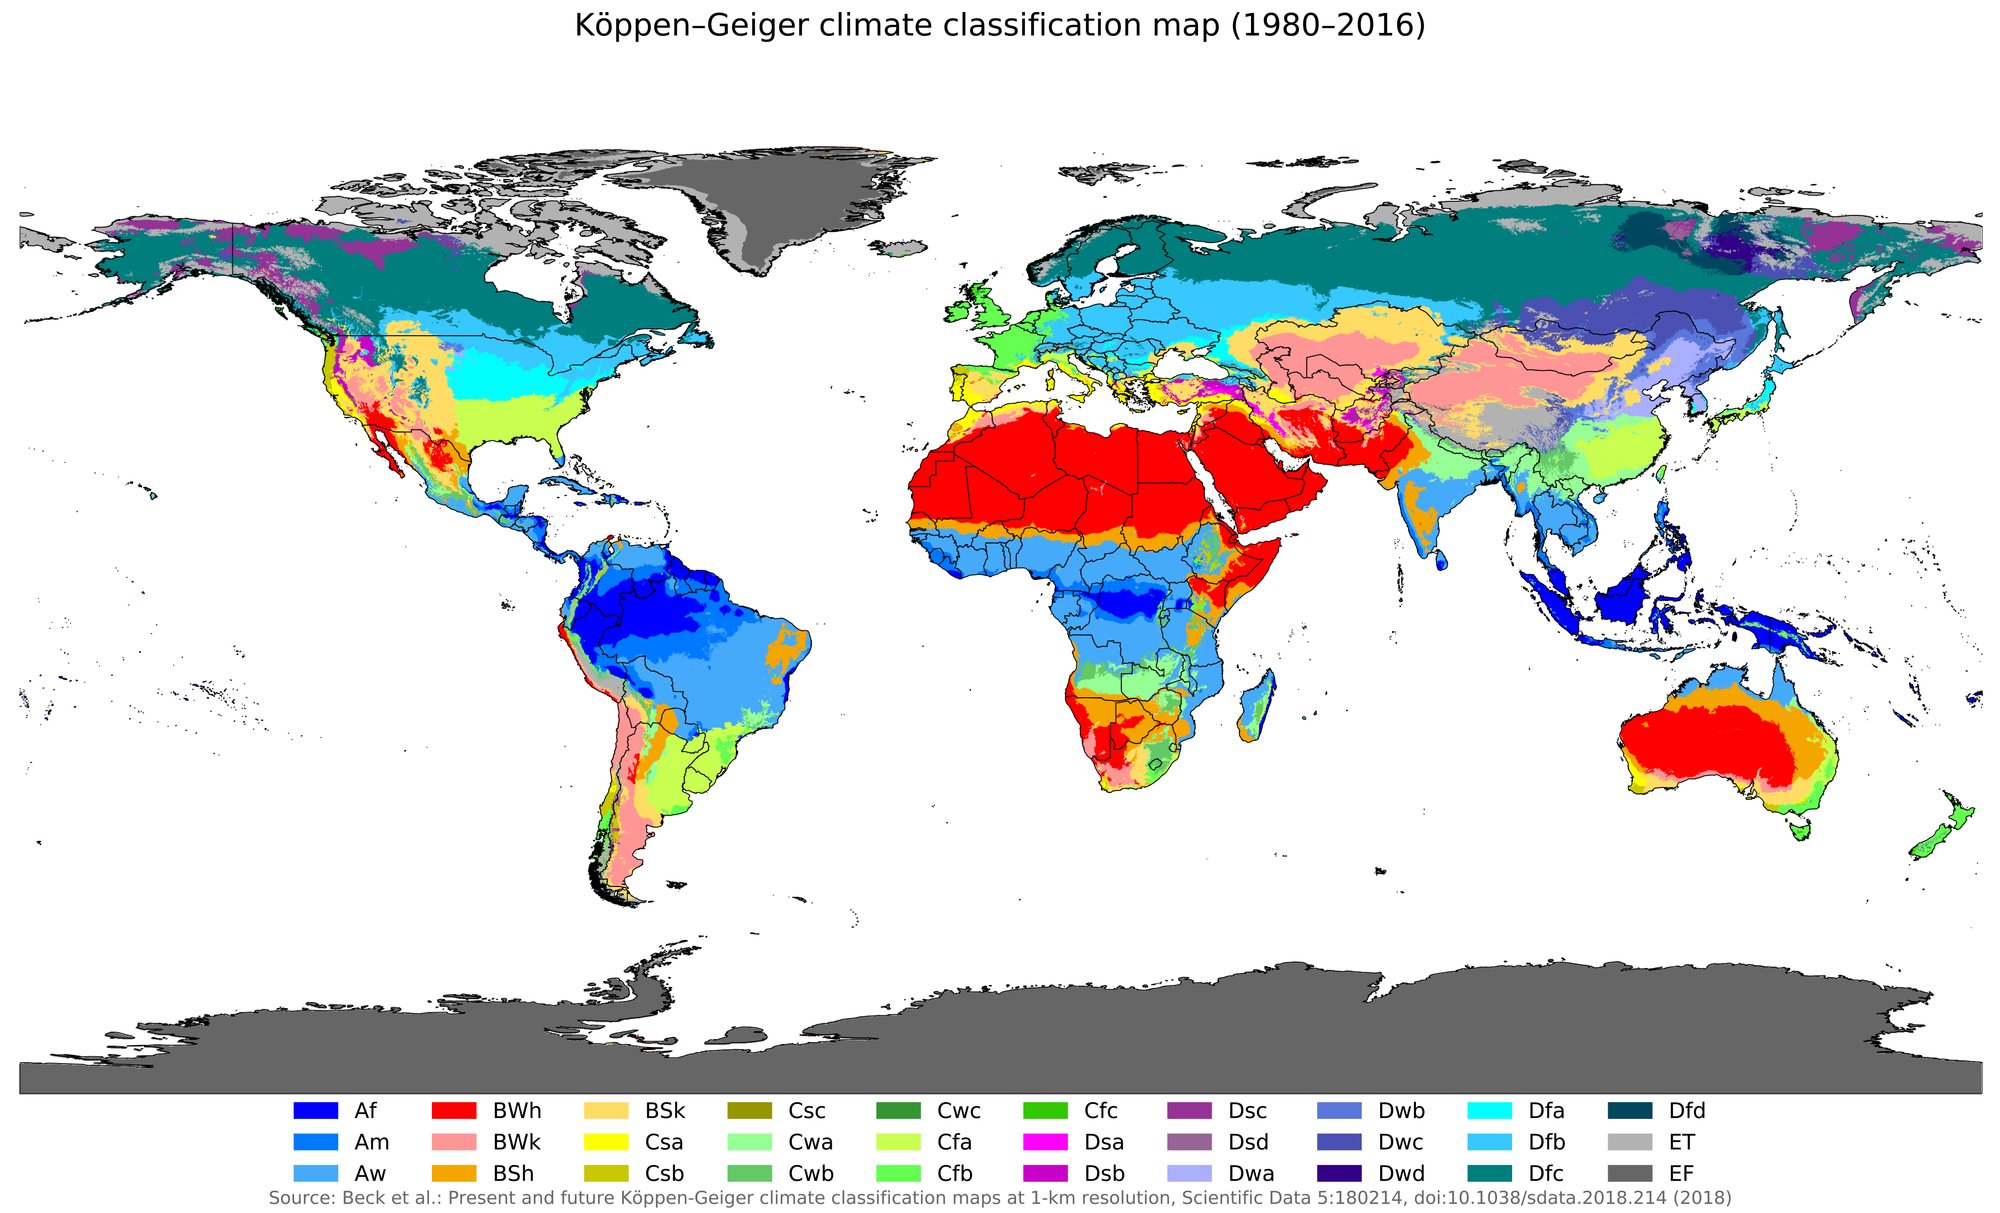
Scientists sort climates using patterns like temperature and precipitation. One widely used system is the Köppen classification.How Climate Is Classified

Nature Doesn’t Love Sharp Borders
These systems draw clear lines between zones. But in the real world, climate usually shifts gradually, not in sudden jumps.How Climate Is Classified