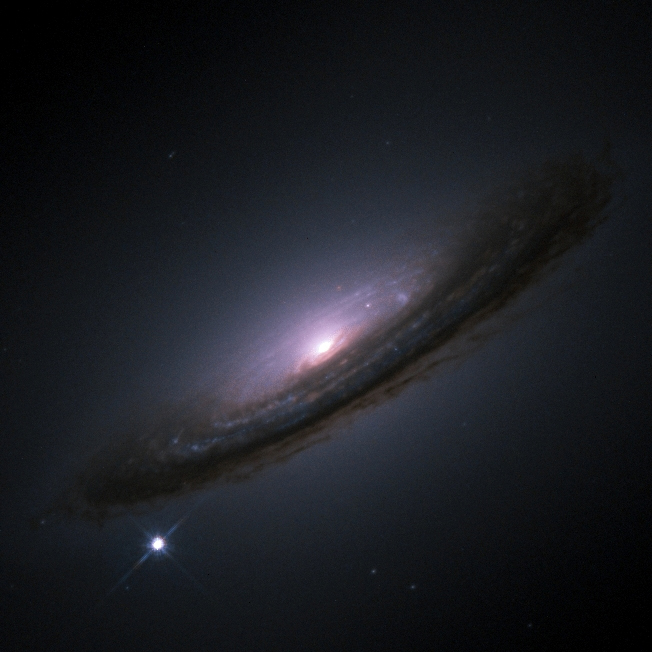
Explosions as cosmic yardsticks.
Type Ia supernovae peak near −19.3 on the magnitude scale, letting astronomers measure vast distances.Supernova: Measuring The Universe
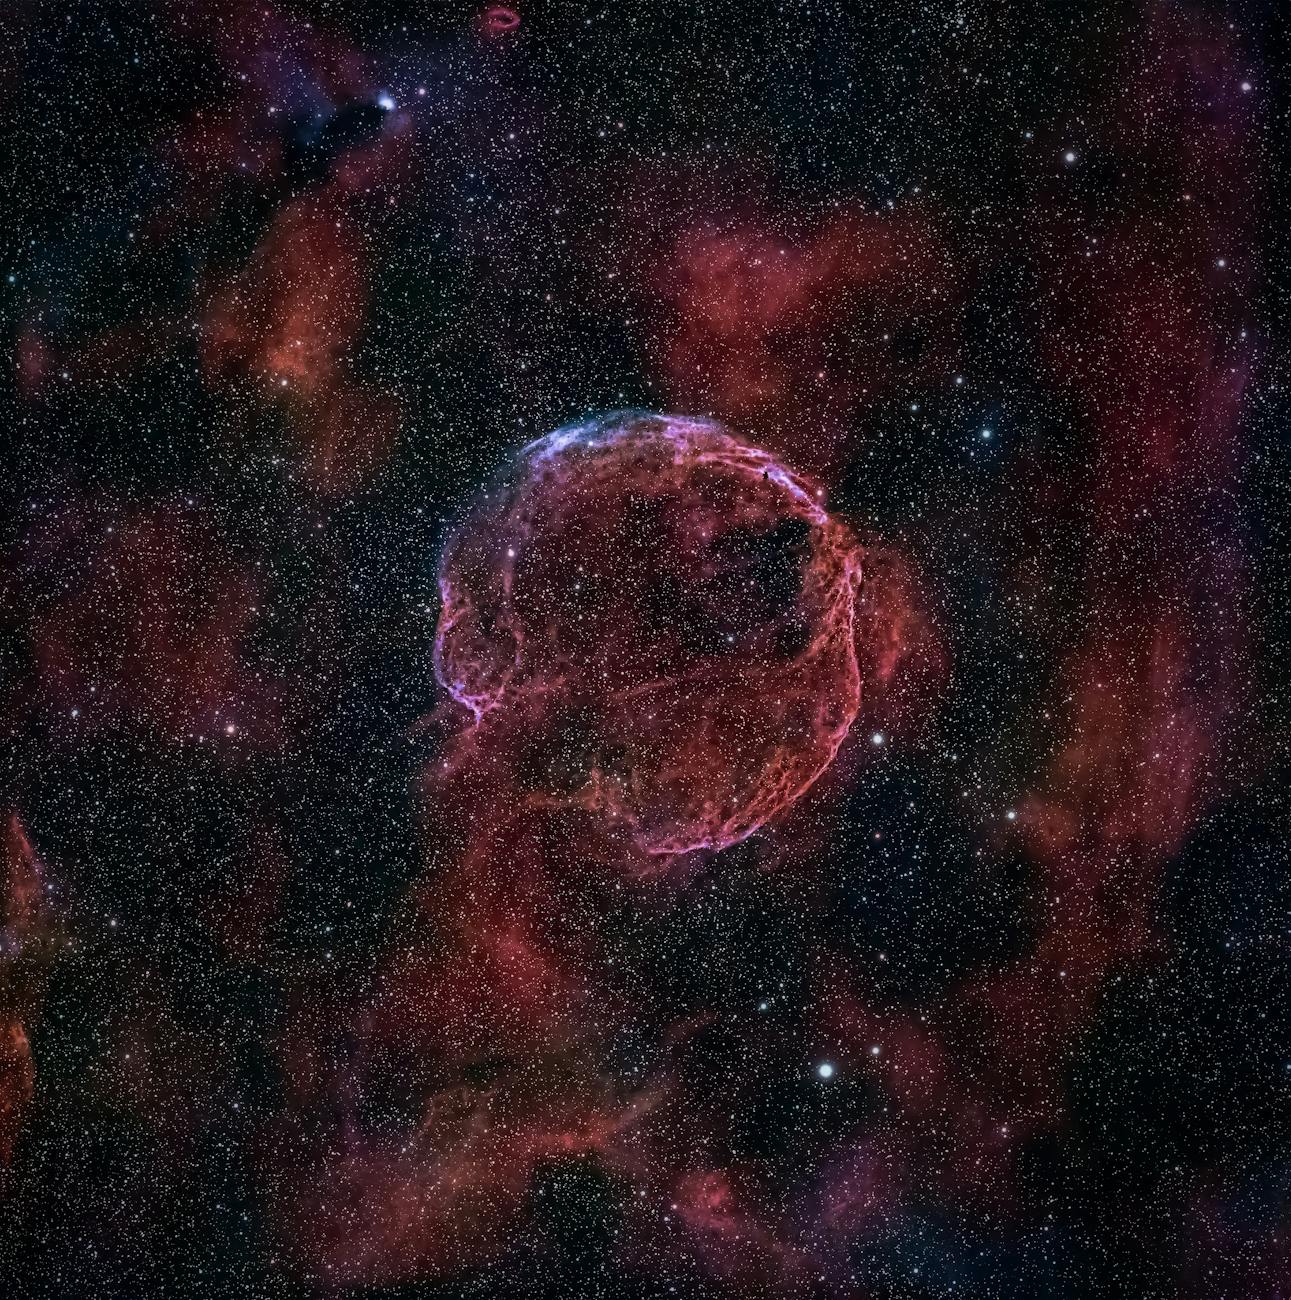
Why so reliable
They arise from similar white dwarfs reaching a critical state, with light powered by decaying nickel‑56 and cobalt‑56.Supernova: Measuring The Universe